
Please Leave Us A Message
Privacy statement: Your privacy is very important to Us. Our company promises not to disclose your personal information to any external company with out your explicit permission.
In 2019, packaging waste generated was estimated at 178.1 kg per inhabitant in the EU. This quantity varied between 74.0 kg per inhabitant in Croatia and 228.0 kg per inhabitant in Ireland. Figure 1 shows that in 2019 paper and cardboard (40.6 %), plastic (19.4 %), glass (19.1 %), wood (15.6 %) and metal (5.0 %) are the most common types of packaging waste in the EU. Other materials represent 0.3 % of the total volume of packaging waste generated in 2019.
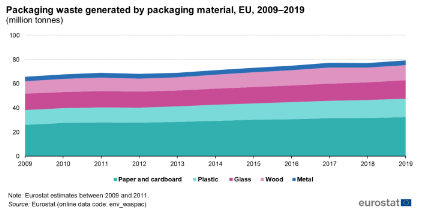
Figure 2 shows the development of packaging waste generated from 2009 to 2019 in the EU. The total quantity of generated packaging materials rose by 13.6 million tonnes from 2009 to 2019 (+20.5 %).
In 2019, the total volume of packaging waste generated was estimated at 79.6 million tonnes – an increase of 2.8 % compared with 2018. This rise was mainly due to the increase in packaging made of glass (+5.0 % compared to 2018) and plastic (+4.1 %). All other types of packaging also increased: metal packaging by 2.0 %, wood packaging by 2.0 % and paper and cardboard by 1.7 %.
Over the 10-year period paper and cardboard was the main packaging waste material generated, contributing with 32.3 million tonnes to the total packaging waste generated in 2019; since 2009 this waste stream grew by 23.7 %. Plastic packaging material reached a total of 15.4 million tonnes as the second most significant material (+26.4 % compared to 2009). Glass had a volume of 15.2 million tonnes (+13.9 %), wood packaging 12.4 million tonnes (+19.8 %) and metal packaging 4.0 million tonnes in 2019 (+6.7 %).
Figure 3 depicts the development of the quantity of waste generated per inhabitant, by main waste materials. Compared with the total volume of generated packaging waste per inhabitant in 2009, which was 149.9 kg, the total volume per inhabitant in 2019 increased by 28.2 kg per inhabitant reaching a peak at 178.1 kg per inhabitant.
_v3.png)
Figure 4 shows the evolution of the volume of all packaging waste per inhabitant generated, recovered and recycled. In comparison to the previous year, the amount of packaging waste generated in 2019 per inhabitant increased by 2.8 %. Packaging waste recovered also increased by 1.7 %. However packaging waste recycled slightly decreased by 0.4 %. Between 2009 and 2019, the amount of packaging waste generated per inhabitant substantially increased by 18.8 %. Recovery and recycling volumes increased even more over the same period, by 26.1 % and 22.3 %, respectively.
_v3.png)
Figure 5 shows the corresponding evolution of the recycling and recovery rates in the period 2009–2019. In the EU, the recycling rate of packaging waste went up from 62.6 % in 2009 to 64.4 % in 2019. The recycling rate and the recovery rate evolved in parallel. The recovery rate including incineration at waste incineration plants with energy recovery rose from 75.8 % in 2009 to 80.4 % in 2019.
_v3.png)
The total amounts of packaging waste generated and recycled are compiled from all packaging materials: glass, paper and cardboard, metal, plastic, wood and others. Figure 6 gives an overview of the data reported by the EU Member States and the EEA/EFTA countries in 2019 on generation and recycling of packaging per inhabitant. There were 14 EU Member States with amounts of packaging waste generated of more than 150 kg per inhabitant in 2019. The amounts of generated packaging waste among the EU Member States in 2019 ranged between 74.0 kg per inhabitant in Croatia and 228.0 kg per inhabitant in Ireland, while the amounts of recycled packaging waste ranged from 36.2 kg per inhabitant in Croatia to 155.2 kg per inhabitant in Luxembourg.
_v4.png)
Article 6 of the Packaging Waste Directive sets out the recovery and recycling targets. The targets had to be met in 2008 for the first time for all countries.
The Packaging Waste Directive sets the following targets: a minimum of 60 % recovery rate (including waste incineration); between 55 % and 80 % of packaging waste to be recycled; with minimum rates of 60 % for glass, paper and cardboard; 50 % for metals; 22.5 % for plastics; and 15 % for wood.
These targets are calculated according to weight, by dividing the amount of packaging waste recycled by the total amount of packaging waste generated. The recycling rate of plastic packaging waste counts exclusively material that is recycled back into plastic.
The recovery and recycling rates of all packaging waste in 2019 of the EU Member States and the EEA/EFTA countries are shown in Table 1. According to these rates, Finland held the highest recovery rate of 115.1 %; the rate of more than 100 % can be explained by storage and following this treatment of waste generated in former years. Belgium had the highest recycling rate of 83.5 %.
Figure 7 shows the share of recovery options for all packaging waste in 2019. The major form of recovery in all countries is recycling. In some countries, energy recovery from packaging waste contributed significantly to the overall recovery rate. In 2019, the highest energy recovery from packaging waste among the EU Member States was recorded in Finland (46.6 %). In some countries, there was no energy recovery from packaging waste. Other forms of recovery contributed only a minor share.
_v3.png)
Figure 8 shows the recycling rate of all packaging waste for the EU Member States and the EEA/EFTA countries in 2019. The recycling covers material recycling and other forms of recycling (e.g. organic recycling). The target of 55 % recycled packaging waste was met by all Member States, except Croatia (48.9 %), Hungary (47.3 %), Romania (44.6 %) and Malta (33.7 %).
_v3.png)
Figure 9 shows the recycling rate of plastic packaging waste for the EU Member States and the EEA/EFTA countries in 2019. The recycling rate includes only material recycling and no other forms of recycling, i.e. exclusively material that is recycled back into plastics.
_v3.png)
The target of 22.5 % recycled plastic packaging waste was met by all Member States, except Malta (15.4 %).
Figure 10 shows the recovery rate of all packaging waste in 2019. All EU Member States and EEA/EFTA countries should have achieved the target of 60 %. Recovery includes energy recovery from packaging waste, other forms of recovery and total recycling. The recovery rates were below the target of 60 % in Poland (59.9 %), Hungary (56.3 %), Croatia (48.9 %), Romania (47.2 %) and Malta (33.7 %).
_v3.png)
The packaging waste data are reported by the EU Member States as laid down in Commission Decision 2005/270/EC. The reported data are usually available in the Eurostat database on waste approximately 20 months after the end of the reference year.
As a first legal basis, Council Directive 85/339/EEC of June 1985 required the establishment of national programs for the reduction in the volume of beverage containers disposed as waste in order to raise consumer awareness of the advantage of using refillable containers. The directive was repealed by the introduction of the European Parliament and Council Directive 94/62/EC of 20 December 1994 on packaging and packaging waste (Packaging Waste Directive). This directive aims at harmonising national measures concerning the management of packaging and packaging waste and lays down measures aimed, as a first priority, at preventing the production of packaging waste and, as additional fundamental principles, at:
It also limits the level of heavy metals in packaging.
Latest legal acts: Directive 2018/852 amending Directive 94/62/EC on packaging and packaging waste will apply for the reporting of data in future. Commission Implementing Decision 2019/665 amending Commission Decision 2005/270 applies from reference year 2018.
Definitions
Packaging is defined as any material that is used to contain, protect, handle, deliver or present goods. Packaging waste can arise from a wide range of sources including supermarkets, retail outlets, manufacturing industries, households, hotels, hospitals, restaurants and transport companies. Items like glass bottles, plastic containers, aluminium cans, food wrappers, timber pallets and drums are all classified as packaging.
Article 3 and Annex I of the Packaging Waste Directive specify `packaging` in further detail.
The main packaging materials are glass, paper and cardboard, plastics, metals (aluminium and steel) and wood.
Composite materials are made of paper, plastic and metal which could not be separated by hand. Composites are reported under their predominant material by weight. Other packaging materials are counted as `others`.
Recovery includes recycling, energy recovery and other forms of recovery. Annex II of the Waste Framework Directive 2008/98/EC (consolidated version) defines energy recovery and other forms of recovery.
The weight of recovered or recycled packaging waste shall be the input of packaging waste to an effective recovery or recycling process. If the output of a sorting plant is sent to effective recycling or recovery processes without significant losses, it is acceptable to consider this output to be the weight of recovered or recycled packaging waste. The weight should exclude non-packaging materials as far as practical.
Reusable packaging Corrugated Box Machine is only counted once in its lifetime and not after every refilling and purchase trip.
The recovery rates of Corrugated Cardboard Machine are the total quantity of recovered materials divided by the total quantity of generated packaging waste.
The recycling rates are usually the total quantity of recycled materials divided by the total quantity of Corrugated Cardboard Line generated packaging waste, except in some cases. The data set 'Recycling rates of packaging waste for monitoring compliance with policy targets, by type of packaging (env_waspacr)' includes, for two types of waste material (plastic and wood), 'Adjusted recycling rate'. That means the recycling rates adjusted for monitoring compliance with policy targets in accordance with Article 6 of Directive 94/62/EC and Article 6b(1) of Decision 2005/270. The relevant rates for those materials are:
Privacy statement: Your privacy is very important to Us. Our company promises not to disclose your personal information to any external company with out your explicit permission.
Fill in more information so that we can get in touch with you faster
Privacy statement: Your privacy is very important to Us. Our company promises not to disclose your personal information to any external company with out your explicit permission.